
The Election Performance Index Documents a Decade’s Improvement in Election Administration
The major gains have been made. The next round of improvements will be subtler.

The MIT Election Data and Science Lab, which I direct, just released the latest edition of the Elections Performance Index. The EPI has assessed the performance of the American election administration system since the 2008 presidential election. This year’s index confirms that the U.S. has seen improvements over the past decade in election convenience and security. The question moving forward is where the next decade’s worth of improvements will come from.

Background: What is the EPI?
The EPI was launched over a decade ago by the Pew Charitable Trusts as part of a project aimed at improving the effectiveness of elections for Americans. The overall effort came at the end of a decade that had seen the quality of American elections called into question by the failings revealed in the 2000 Florida recount. Among these failings were voting machines that didn’t work, poor ballot design, antiquated information systems, and inaccurate voter lists.
The decade of the aughts was marked by election reform efforts, the most consequential of which was the passage of the Help America Vote Act in 2002. In the midst of these reform efforts, many voices began asking, “How will we know if elections have improved?” One of these voices was Heather Gerken, then a law professor at Yale and now the president of the Ford Foundation. In an influential book, The Democracy Index, Gerken proposed creating a state-by-state rating based on how well they conduct elections, akin to U.S. News & World Report’s college rankings.
Inspired by Gerken’s idea, Pew assembled a large advisory group of election officials and academics who spent three years hammering on the question of how to assess the convenience and security of elections at the state level. The result was the Elections Performance Index. Pew handed over management of the EPI to MEDSL in 2017, and we have updated it biennially ever since.
At the core of the EPI are 19 indicators1 that measure a variety of factors involved in the administration of elections. Most of these measures gauge policy outcomes, such as mail ballot rejection rates, wait times to vote, and voter turnout. Other indicators measure the presence of state policies meant to enhance security and the integrity of outcomes (post-election audits, ERIC membership, etc.).
The EPI is the Elections Performance Index. While the EPI website allows users to explore state performance for each indicator, the bottom line is a single index score on a 0–100% scale. The index itself is calculated by averaging scores across the 19 indicators, each of which has also been converted to a 0–100% scale.
While the EPI website ranks the states and D.C. from top to bottom based on the index score, we at MEDSL do not emphasize this ranking for two reasons. First, we want to emphasize that every state is capable of improving, and that it is primarily important to know that a state is improving, and only secondarily to know if it is improving compared to other states. Second, over time, as states overall have improved, their index scores have begun to bunch in the 80s, to the point where moving from 81.7% to 80.4% means dropping from number 17 to number 27 in the rankings, which doesn’t seem especially informative.
There’s much more to be said about the EPI background, much of which can be read in the hundred-page EPI methodology document.
The Big Story: Improvement Since 2008
Across the five presidential elections rated by the EPI, average scores have risen markedly. The most rapid period of improvement occurred from 2008 to 2020, when average index values rose from 62.3% to 80.4%. In addition, with one exception, every state’s score has improved, in some cases substantially. (The one exception is North Dakota, which started at the top with a score of 83.9% in 2008, and then retreated to 82.6% in 2024.)
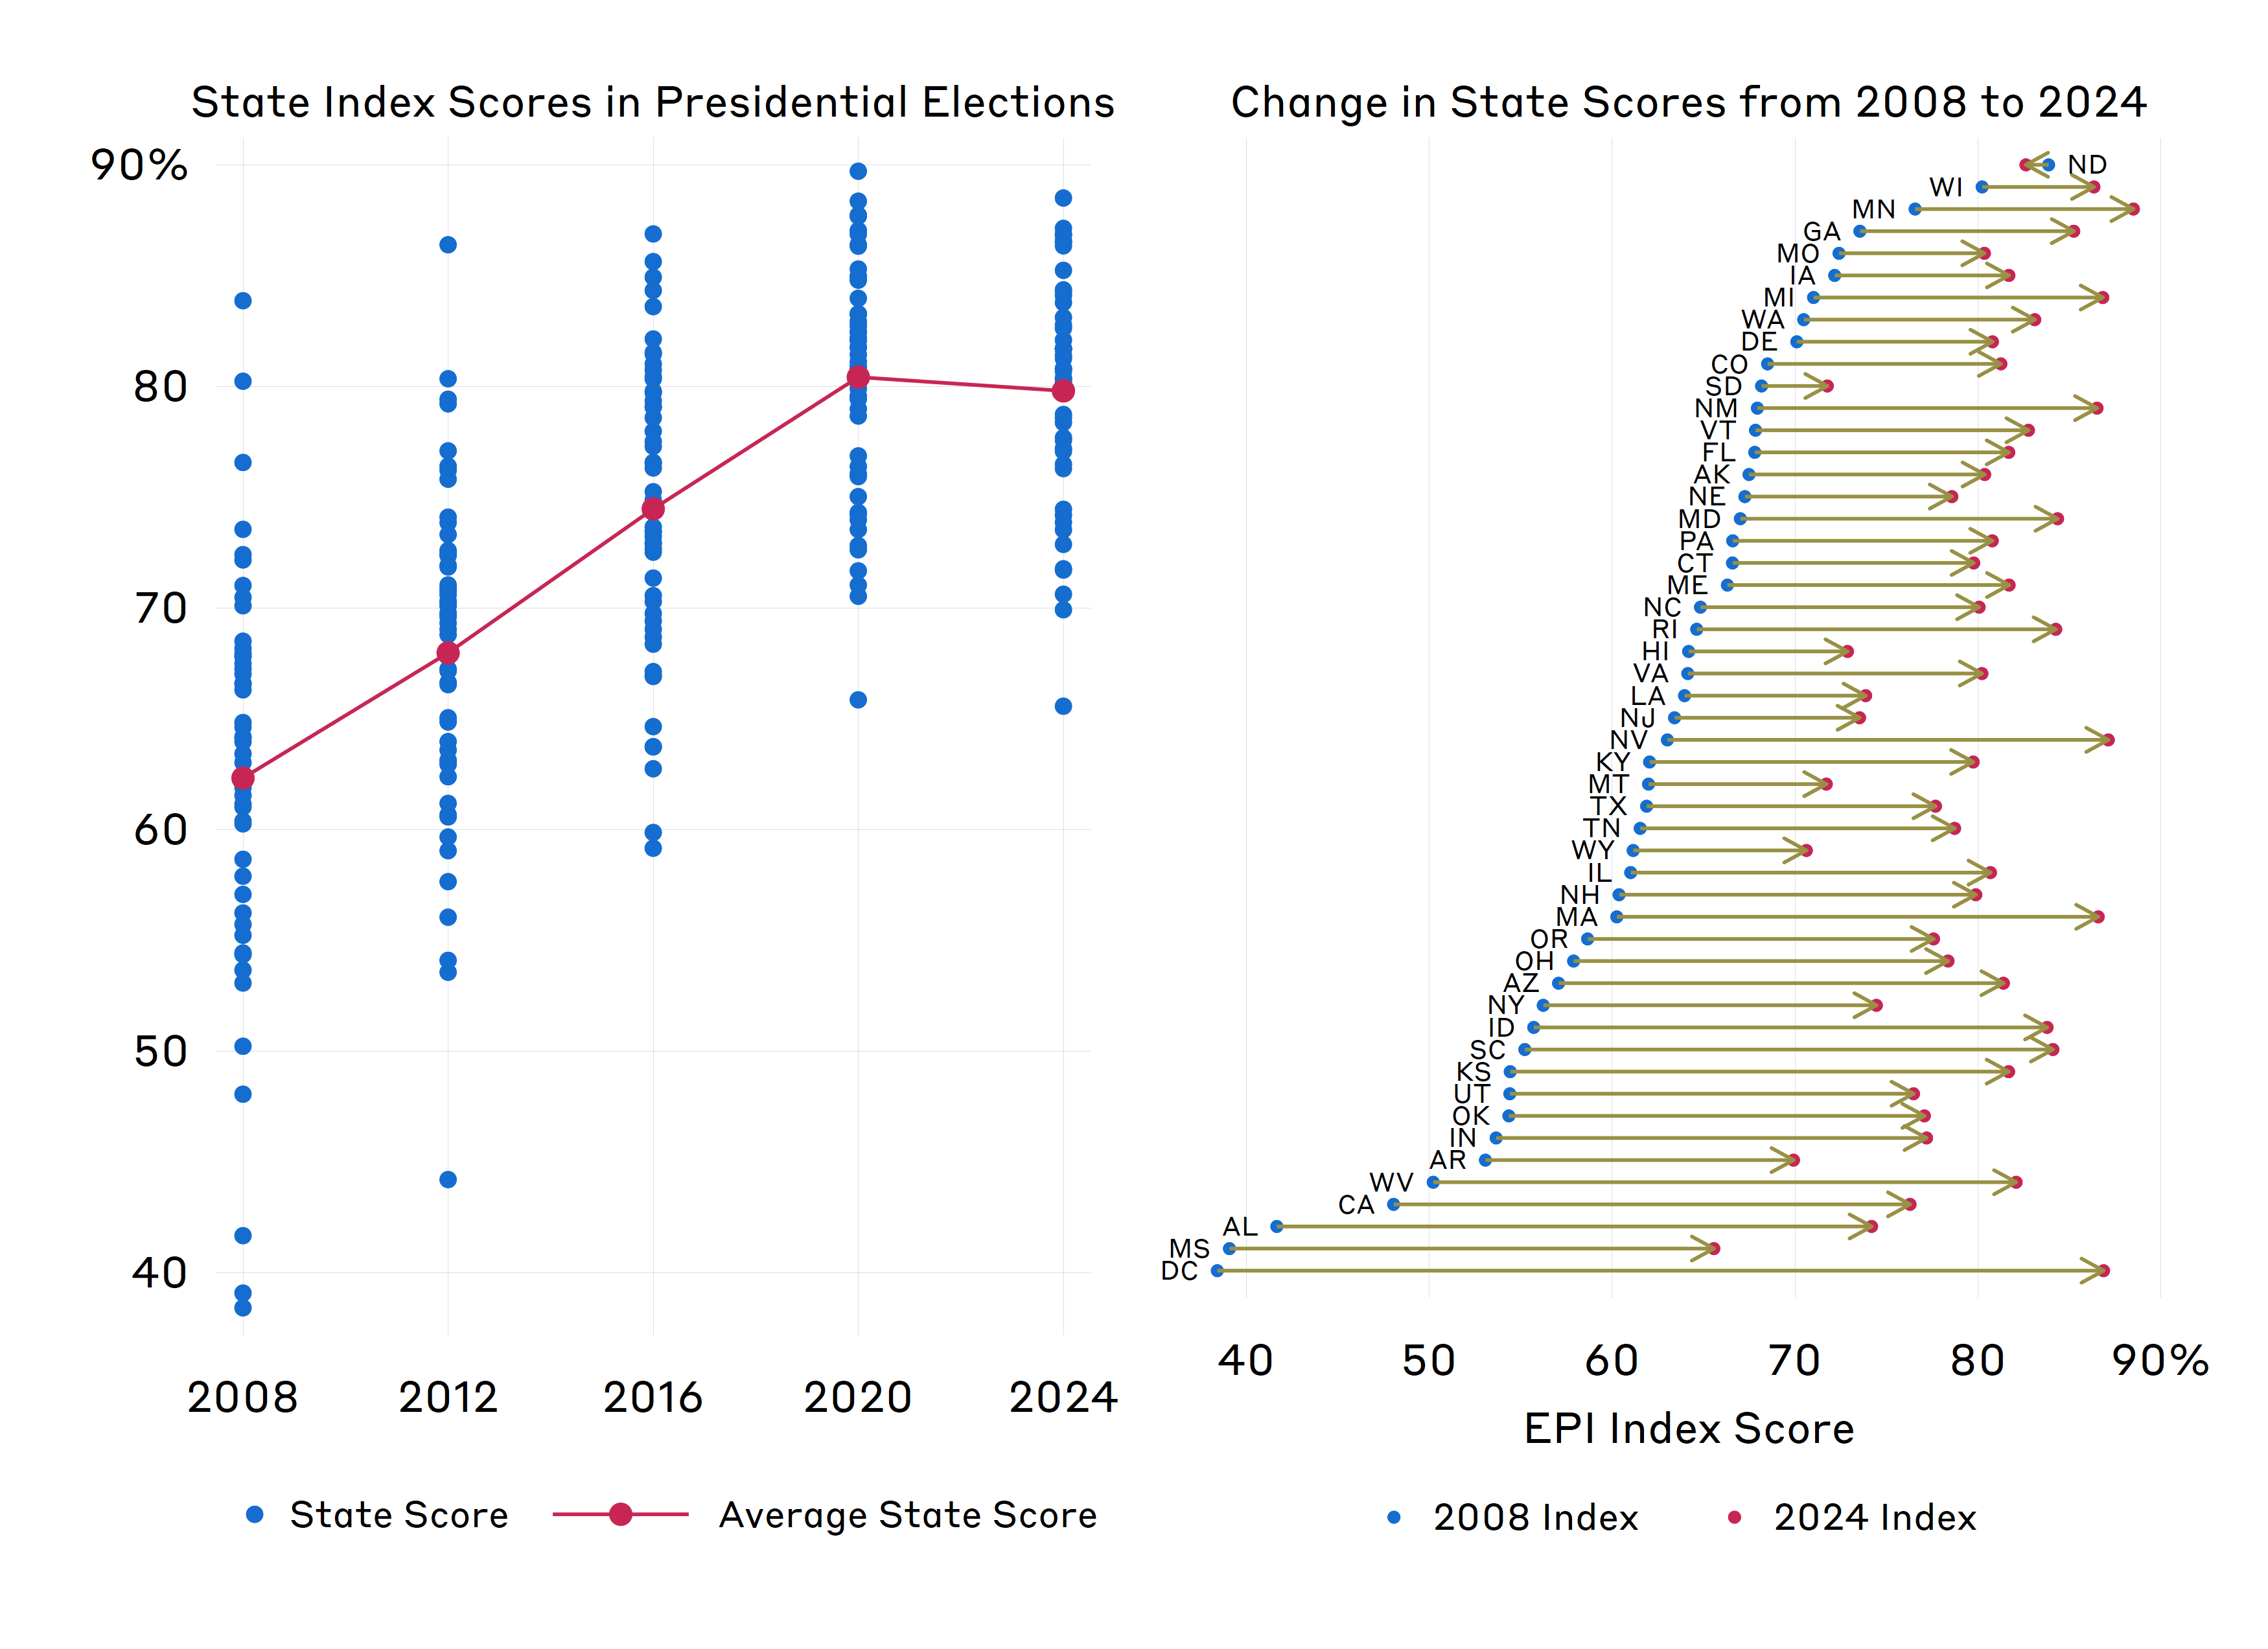
The average index score slipped a bit in 2024, to 79.8%, but I interpret that as a flattening of the improvement curve rather than nationwide backsliding.
The Greatest Improvements Have Occurred in Online Presence and Auditing
To understand where the EPI has improved over the past five presidential elections, we need to dig a bit deeper into the indicators themselves. One way to classify them is functionally—absentee ballot management, voter registration management, post-election auditing, etc. Another is to classify them as either measured on a binary yes/no scale or on a continuous scale. Binary indicators include things like whether a state allows online voter registration or requires post-election tabulation audits. Continuous scales include measures such as turnout rate and average wait times.
If we examine the change in the index components from 2008 to 2024, we see that, by far, the biggest improvements have been in three binary indicators: allowing online registration, requiring post-election tabulation audits, and being a member of the Electronic Registration Information Center (ERIC). The fourth-biggest improver behaves almost like a binary measure and captures how many lookup tools a state has on its website, out of five.2
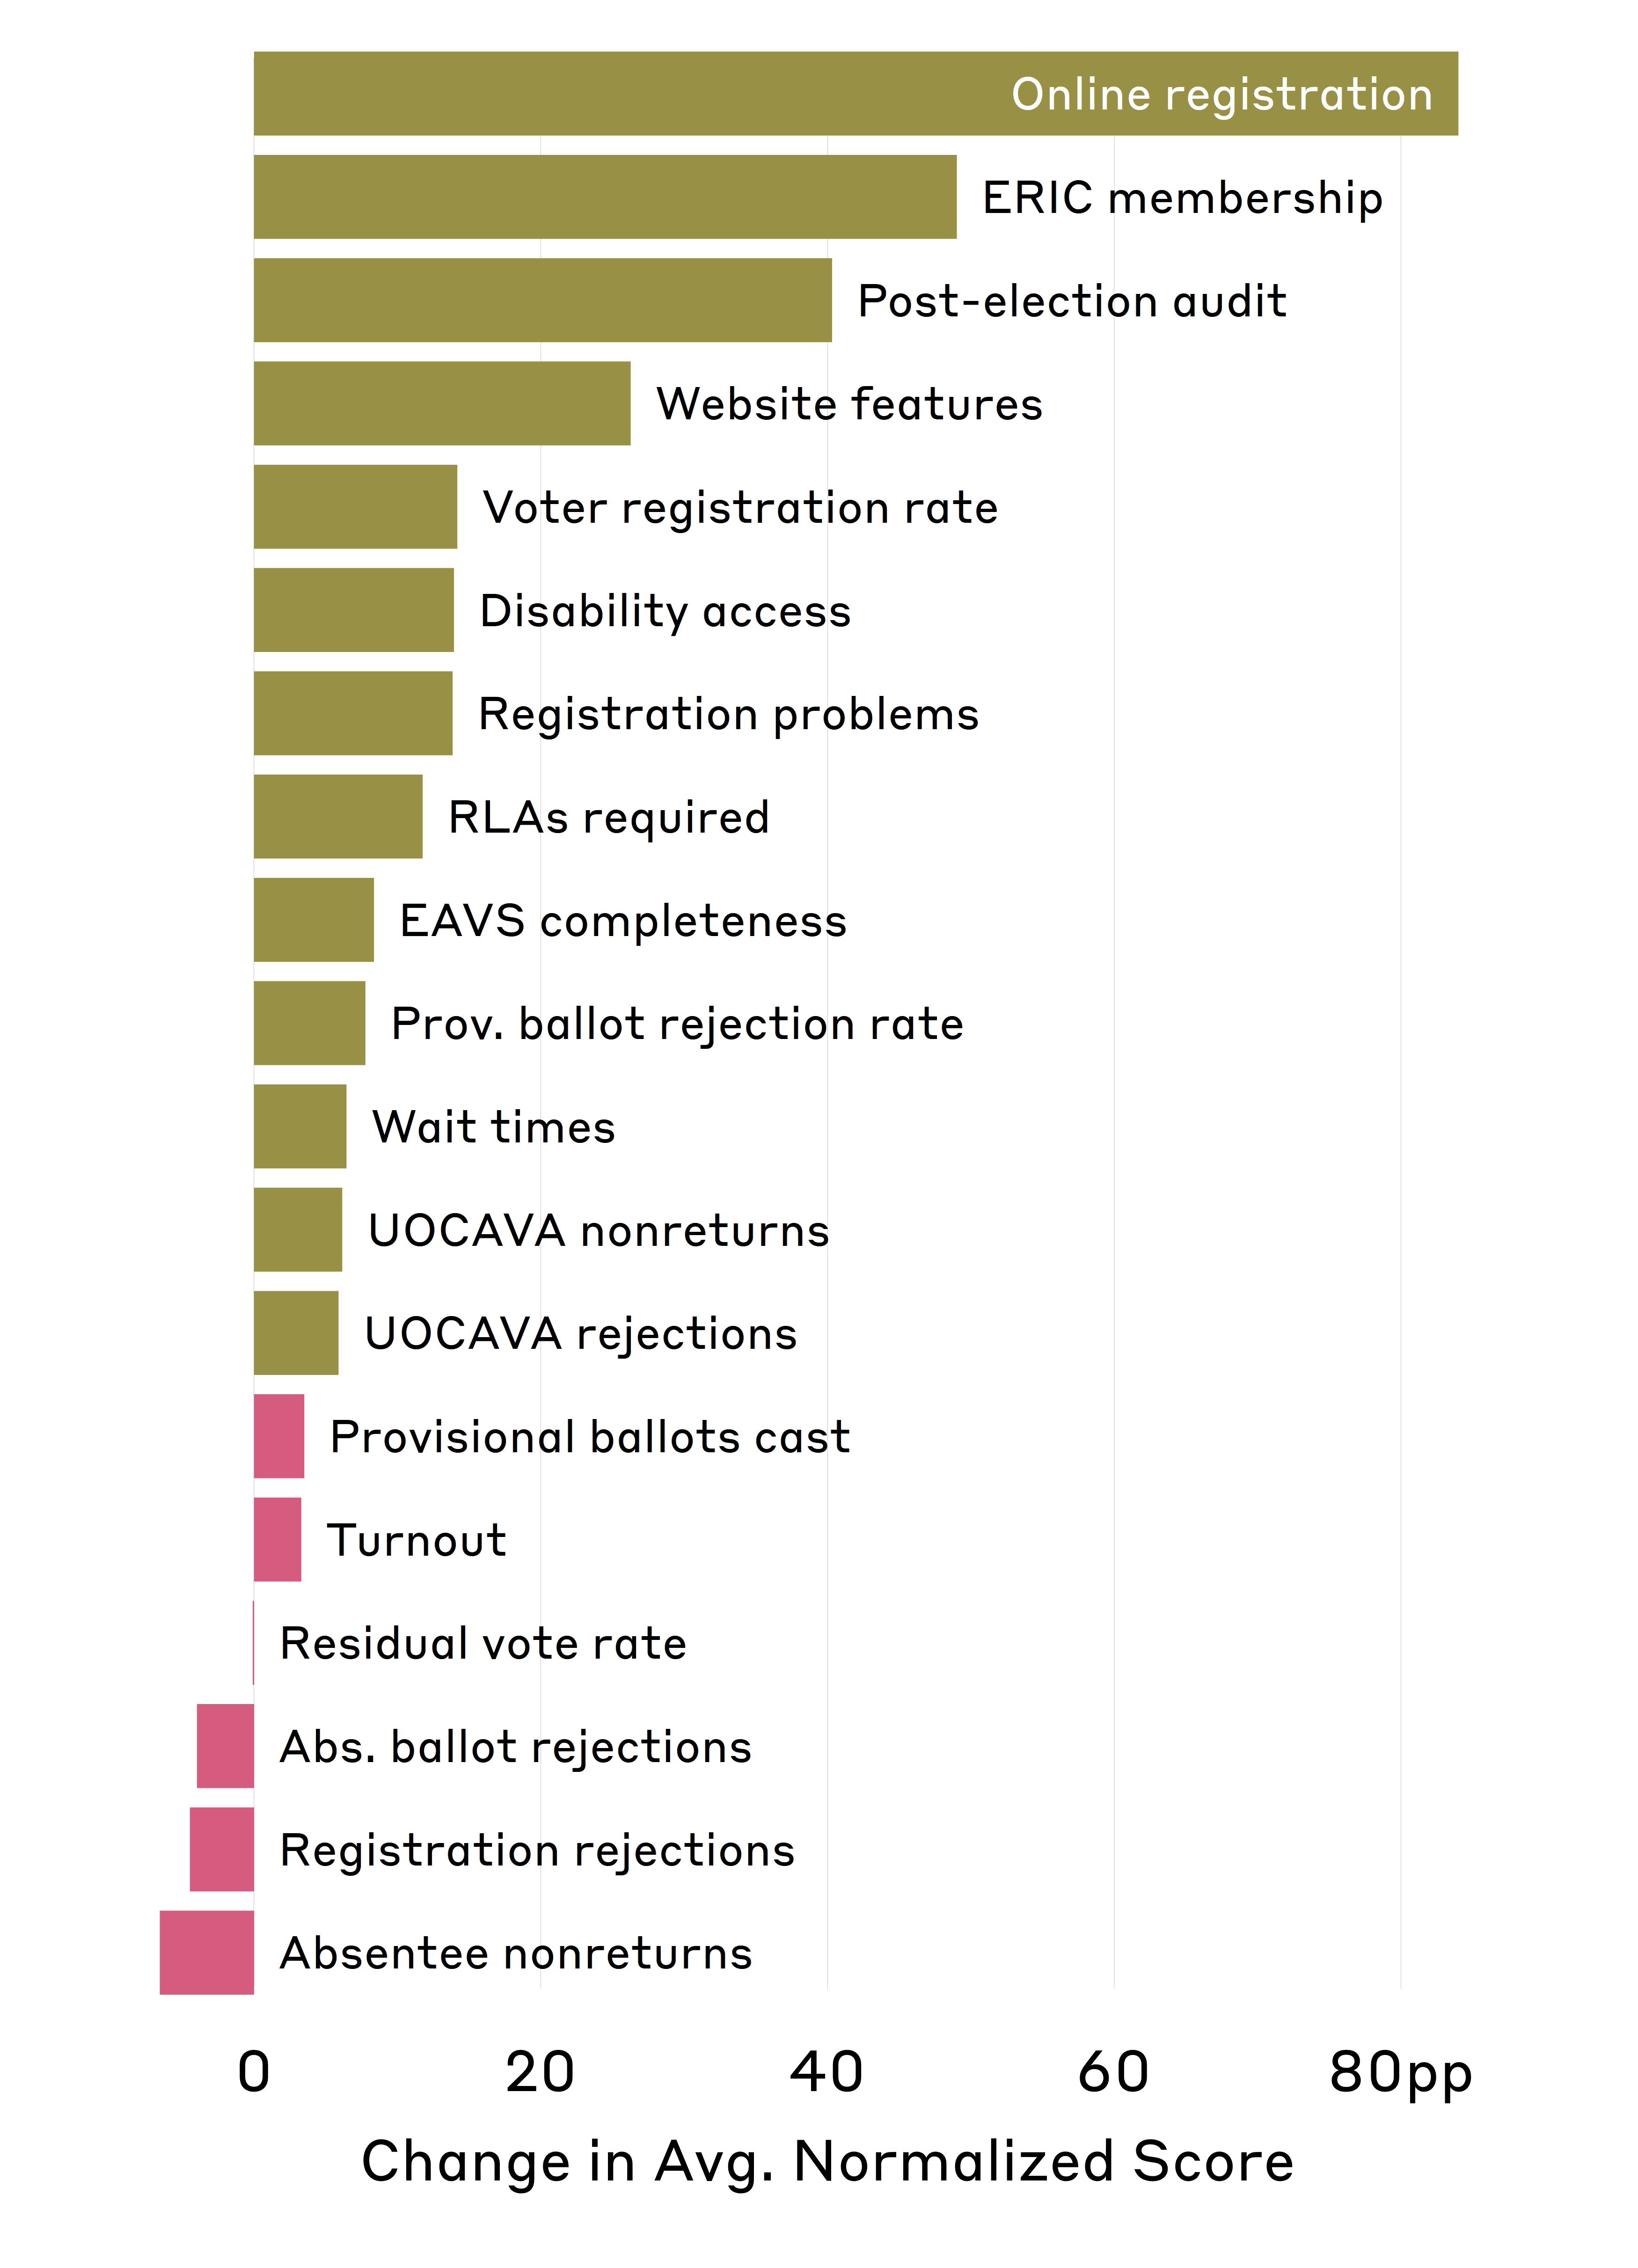
The continuous indicator that has improved the most measures disability access, followed by one that captures the degree to which people cite voter registration problems as a reason for not voting.
These remaining indicators all address difficult-to-change practices that must generally be implemented at the precinct level, whereas the first four can usually be changed with a single decision by the state’s chief election official or the legislature.3
Take the provisional ballot rejection rate indicator, for example. This indicator measures the number of provisional ballots rejected in a state, divided by the total number of provisional ballots cast. For a state to move from the bottom to the top of this indicator, it would have to significantly revamp its voter registration system, voter registration requirements, and precinct check-in practices, and then carry those practice changes to every precinct in the state. That’s a far cry from changing just one website, which can be challenging enough.
Indeed, I know of one state, which will remain anonymous, that contacted me early in the life of the EPI to tell me that their low performance on the provisional ballot cast indicator had prompted them to change how questioned voter registrations were handled statewide. They worked hard to change state regulations and then to train local officials on the new system. That state now issues about 25% fewer provisional ballots than in 2008. T hat’s not nothing, but all that effort only increased their index score by a fraction of a point. On the other hand, adding online registration and website capabilities increased its score by almost ten points.
All this means that actually improving the practice of election administration at the precinct level is orders of magnitude harder than improving services centrally. Given those differences, I still think it’s an accomplishment that almost every indicator, whether binary or continuous, has improved steadily since 2008. There remain a few states where significant operational gains could be made—for instance, those with longer average wait times than in the best-performing states—but these changes will require prioritizing these areas of practice statewide over multiple election cycles.
Whither the EPI?
The EPI was developed at the end of a decade that was kicked off by the most consequential election administration failure in American history. Constrained by data availability and methodological considerations, the EPI reflected many of the concerns of the time and was infused with the belief that shining a light on performance could spur improvements. An honest assessment of the EPI would conclude that it has had an important supporting role in spurring the high-priority reforms that seemed most important a decade ago.
The question to consider at this juncture is whether the EPI should change and, if so, how?
The simplest sub-question to consider is whether new indicators should be added and others retired. New issues have come into view over the past decade, such as cybersecurity and list maintenance, two aspects of election administration that are not reflected in the EPI. Indeed, as we wrote in the original methodology document, measures of security and integrity are generally underrepresented, despite our intention to treat them as equally important, whereas voter convenience remains relatively overrepresented in practice.
A harder question is how to make the EPI more central to policy debates about election administration. A close look at the EPI shows that many indicators reflect policies beyond the control of election administrators. (One indicator, turnout, is mostly a consequence of demographics and political campaigns.) And yet, over the years, I’ve noticed that it is mostly election administrators who pay attention to the EPI and feel aggrieved when their state performs poorly—often not because of something they’ve done, but because of their adherence to the law, which is their first duty.
The EPI is a policy wonk’s index. It exists alongside other efforts to rate state elections, such as the Cost of Voting Index and the Election Integrity Scorecard, which emphasize state laws rather than a comprehensive suite of output measures. (This is not to cast shade on these other indices, which do a good job of communicating their values and rating states accordingly.)
I continue to believe that voters are best served when they can cast a ballot conveniently and accurately, and can be assured that their ballot will count honestly. This relies on the basics of election administration being well executed—the blocking and tackling of elections, as I often call it. At the end of the day, that is what the EPI is all about.
In midterm years, the number of indicators is 18.
These lookup tools are (1) voter registration verification, (2) polling place location, (3) sample ballots, (4) absentee ballot locators, and (5) provisional ballot status.
This is not to underestimate the difficulty of getting policy change at the state level.